Currently viewing: Chief Financial Officer’s review / Next: Southern Africa footprint
Looking ahead, the uncertainty around the pandemic remain. Cost stewardship, capital discipline and continued strong cash flow generation is key to delivering on the long-term success of the Group.
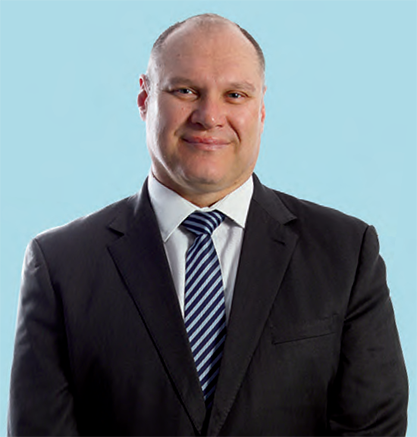
Chief Financial Officer
Pieter van der Westhuizen
Life Healthcare’s 2020 financial year was a year of vastly different halves. The Group delivered an excellent performance during H1 FY2020 but trading was significantly impacted in H2 FY2020 by the COVID-19 pandemic. The primary focus of the Group in H2 FY2020 was to manage the impact of the pandemic. A number of actions were taken over the period since the outbreak of the pandemic to ensure that we continued to deliver a safe environment providing quality care to our patients, protect the health, safety and job security of our employees in the short term and preserve liquidity. While there is still a high degree of uncertainty regarding the future progression of the pandemic, the Group is pleased with its response to the challenges that arose during H2 FY2020 and we are confident that the lessons learned will enable us to respond effectively to future COVID-19-related challenges.
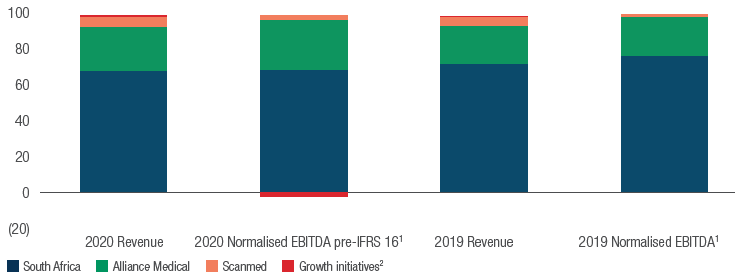
Revenue for the year ended 30 September 2020 decreased by 1.1% against last year and Group normalised EBITDA before the impact of IFRS 16 is 28.4% down against last year. Normalised EBITDA was impacted to a greater extent, due to additional costs associated with the pandemic and negative operational leverage due to lower activity levels.
| FY2020 R’m |
FY2019 R’m |
H1 FY2020 R’m |
H1 FY2019 R’m |
H2 FY2020 R’m |
H2 FY2019 R’m |
|||||||
| Revenue | 25 386 | 25 672 | 13 244 | 12 399 | 12 142 | 13 273 | ||||||
|---|---|---|---|---|---|---|---|---|---|---|---|---|
| Normalised EBITDA pre-IFRS 16 | 4 098 | 5 727 | 2 806 | 2 733 | 1 292 | 2 994 | ||||||
| Attributable (loss)/profit | (93) | 2 569 | 781 | 357 | (874) | 2 212 |
| Indicator | Year-on-year trend (%) |
FY2020 R’m |
FY2019 R’m |
||||
| Growth | |||||||
| Net debt: normalised EBITDA (ratio), amended debt covenant is <4.0x |  |
2.96 | 1.96 | ||||
| Interest cover (ratio), amended debt covenant is >3.75 |  |
5.81 | 5.6 | ||||
| HEPS (cps) | |
48.7 | 88.7 | ||||
| Dividend (cps) | |
– | 93.0 | ||||
| EBITA | |
2 752 | 4 491 | ||||
| Free cash flow before transaction costs | |
1 790 | 2 342 | ||||
| Efficiency | |||||||
| Cash generated from operations as percentage of EBITDA | |
111.3 | 103.5 | ||||
| Normalised EBITDA margin (%) | |
17.1 | 22.3 |
1 Interest cover improved mainly due to settling of debt out of proceeds from the disposal of Max.
| Change % |
FY2020 R’m |
FY2019 R’m |
||||
| Revenue | (1.1) | 25 386 | 25 672 | |||
|---|---|---|---|---|---|---|
| Normalised EBITDA1 | (24.1) | 4 346 | 5 727 | |||
| EBITA | (38.7) | 2 752 | 4 491 | |||
| Operating profit | (44.7) | 2 180 | 3 944 | |||
| Non-operating (expense)/income | >(100) | (788) | 742 | |||
| Net finance cost | (17.3) | (825) | (998) | |||
| Share of associate’s net profit after tax | (22.2) | 14 | 18 | |||
| Profit for the year | (98.6) | 38 | 2 871 | |||
| Profit attributable to ordinary equity holders | >(100) | (93) | 2 569 |
| 1 | Life Healthcare defines normalised EBITDA as operating profit before depreciation on property, plant and equipment, amortisation of intangible assets and non-trading related costs and income. |
|
1 2 |
Excludes the impact of IFRS 16. Growth initiatives comprises new outpatient models, imaging and other in southern Africa and LMI internationally. |
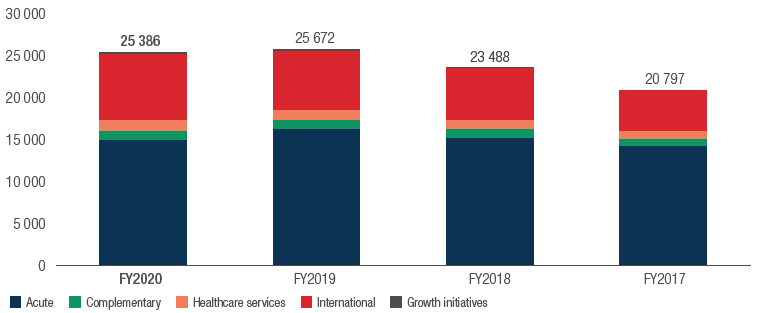
Group revenue decreased by 1.1% to R25.4 billion (2019: 25.7 billion) consisting of a 6.6% decrease in southern African revenue to R17.2 billion (2019: R18.5 billion), a 12.8% increase in international revenue to R7.8 billion (2019: R6.9 billion) and R320 million revenue contribution from growth initiatives (2019: R269 million). Normalised EBITDA pre-IFRS 16 decreased by 28.4% to R4.1 billion (2019: R5.7 billion). Normalised EBITDA was negatively impacted by the pandemic and related costs. The Group benefitted from the weakening of the Rand.
Revenue for the southern African operations for the year under review decreased by 6.6% to R17.2 billion (2019: R18.5 billion) and normalised EBITDA pre-IFRS 16 decreased by 35.5% to R2.8 billion (2019: R4.4 billion). The main operating segment, hospitals and complementary services, did well to manage the pandemic. The overall weighted occupancy for the year decreased to 58.4% (2019: 69.7%). Paid patient days (PPDs) for the year decreased by 15.7% (2019: +0.8%) with PPDs for H2 FY2020 declining by 30.5% (H1 FY2020: +0.2%). The revenue per PPD for the year increased by 8.9% from FY2019. The higher than expected increase is due to a change in case mix as well as an increased proportion of higher acuity patients being admitted to hospital. The increase in revenue per PPD is made up of a 4.4% tariff increase and a 4.5% positive change in case mix.
Healthcare services was less affected with revenue for the year up 6.9% to R1 346 million (2019 R1 259 million) and normalised EBITDA pre-IFRS 16 down 9.5% to R134 million (2019: R148 million).
Normalised EBITDA pre-IFRS 16, for the southern African operations, decreased by 35.5% with a normalised EBITDA margin pre-IFRS 16 of 16.5% for the year (2019: 23.8%). As a large percentage of costs are fixed, the decline in activities due to the pandemic had a direct impact on the normalised EBITDA margin. The pandemic also resulted in additional costs incurred of approximately R244 million. The normalised EBITDA margin excluding the estimated pandemic impact was 23.7%.
The southern African operations were a victim of a criminal cyber-attack in June 2020. In response, the Group immediately took its systems offline and switched to manual processes and procedures. Although the care of patients was not impacted, the Group was unable to issue bills for a period of around 45 days. This billing backlog was resolved by end August 2020 and most of the outstanding accounts were collected by end September 2020. The direct costs of the restoration of the information technology (IT) infrastructure amounted to R64 million.
Revenue in diagnostic services increased by 12.6% to R6.3 billion (2019: R5.6 billion). This increase was driven by the good growth of the volumes within our PET-CT centres (1.8 %) in the UK, along with additional services to support governments’ responses to the pandemic and the weakening of the rand against the pound sterling and the euro. Revenue in diagnostic services was negatively impacted by the pandemic, from February 2020 but more acutely between mid-March 2020 and mid-May 2020, with scan volumes dropping by an average 60% to 65% against pre-COVID-19 levels. Up to the end of February 2020, revenue in pound sterling was 8.4% ahead of the prior period. However, due to the impact of the pandemic, revenue in pound sterling for the year ended 30 September 2020 only increased by 0.3% compared to the prior year. The Alliance Medical operations showed good recovery in diagnostic scan volumes from June 2020 with Q4 FY2020 scan volumes up 0.2% against Q4 FY2019.
Within our UK business, our fourth cyclotron site in Preston was reopened in March 2020 after a period of closure for refurbishment. By having four sites operational again, we were able to meet demand, providing a more reliable PET-CT service. The fifth site, Dinnington, is going through its final accreditation and should be able to produce commercially from Q2 FY2021. This will further enhance our reliability of isotope production.
PET-CT scan volumes were impacted less severely than other modalities during the initial pandemic surge between mid-March 2020 and mid-May 2020. The full-year volume growth in our PET-CT scan centres in the UK was 1.8%, with Q4 FY2020 showing growth of 5.2% against Q4 FY2019.
Normalised EBITDA pre-IFRS 16 for diagnostic services was R1.2 billion (2019: R1.3 billion). The normalised EBITDA margin pre-IFRS 16 for Alliance Medical of 18.8% (2019: 22.4%) was negatively impacted by the pandemic. The normalised EBITDA margin, excluding the estimated pandemic impact, net of the benefit received due to the additional services to governments to support their COVID-19 response alongside cost-saving initiatives, was 21.9%.
Scanmed revenue for the year under review increased by 13.8% to R1 535 million (2019: R1 349 million). The normalised EBITDA margin pre-IFRS 16 increased to 9.1% (2019: 7.2%).
Scanmed had a good performance in the year under review, with an improvement on the prior year, as some of its facilities were designated as non-COVID-19 facilities and provided elective treatments to patients from other government facilities. The Group restarted the Scanmed disposal process during September 2020, and received an offer during November 2020 to dispose of its Polish operation. The offer is lower than the carrying value of Scanmed at 30 September 2020. With the receipt of the offer, it is considered prudent and appropriate to impair the carrying value at 30 September 2020 to reflect the value of the offer. The impairment for the year under review relating to Scanmed is R793 million. The disposal of Scanmed is in line with the Group’s previously communicated strategy. A disposal agreement was signed on 24 November 2020 for an enterprise value of PLN340 million. The disposal consideration will be settled in cash and Life Healthcare will receive approximately PLN199 million after settling debt in Poland. The full proceeds will be used to reduce the Group’s debt levels. The disposal will be subject, inter alia, to regulatory approvals in Europe.
Growth initiatives comprise the development of a new outpatient business model, the development of the imaging services opportunity in South Africa, the investment in data analytics, and clinical quality products in South Africa and product development internationally.
The Group has made good progress with its imaging services opportunity in South Africa but delays were experienced in the execution of its first few transactions due to the pandemic. The acquisition process has restarted and the Group hopes to conclude transactions in H1 FY2021.
The outpatient business model continues to evolve and we have two standalone clinics, and four retail clinics in partnership with a large retailer. The management team has successfully developed a COVID-19 symptom checker, as well as a telemedicine tool with the ability to offer direct-to-patient doctor virtual consultations.
LMI, our primary international growth initiative, had a strong performance and contributed revenue of R319 million (2019: R268 million) and a normalised EBITDA pre-IFRS 16 loss of R7 million (2019: profit of R18 million). The loss in the year under review included a non-trading foreign exchange loss of R8 million (2019: profit: R30 million). Excluding this item the normalised EBITDA for 2020 was R1 million (2019: loss of R12 million) achieving its objective of breaking even in 2020 at normalised EBITDA level.
| Growth initiatives contribution (R’m) | FY20201 | FY2019 | FY2018 | |||
| Revenue | 320 | 269 | 66 | |||
|---|---|---|---|---|---|---|
| Normalised EBITDA | (64) | (25) | (45) | |||
| Depreciation | (14) | (10) | (2) | |||
| EBITA | (78) | (35) | (47) | |||
| Amortisation | (20) | (18) | (19) | |||
| Operating loss | (98) | (53) | (66) |
| 1 | Excludes the impact of IFRS 16. |
EPS decreased by more than 100% to a loss of 6.4 cps (2019: 176.4 cps). The impairment of R793 million relating to Scanmed reduced EPS by 54.5 cps. HEPS decreased by 45.1% to 48.7 cps (2019: 88.7 cps). Normalised EPS (NEPS), which excludes non-trading related items, decreased by 47.6% to 61.0 cps (2019: 116.4 cps). EPS, HEPS and NEPS for the year ended 30 September 2020 include the impact of IFRS 16 (2019: no impact). Earnings in the prior year included a non-recurring profit on the disposal of our equity investment in Max Healthcare (net profit on the disposal in FY2019 of 68.5 cps). The earnings in the year under review have been positively impacted (+9.3 cps) by the reduction in post-tax interest cost of R135 million as a result of the repayment of debt in Q4 FY2019, following the disposal.
| Change % |
FY2020 R’m |
FY2019 R’m |
||||
| Weighted average number of shares (million) | (0.1) | 1 455 | 1 456 | |||
|---|---|---|---|---|---|---|
| EPS (cents) | >(100) | (6.4) | 176.4 | |||
| Impairments of assets and investments | 54.9 | 9.6 | ||||
| Profit in disposals of investments and PPE | 0.2 | (97.3) | ||||
| HEPS (cents) | (45.1) | 48.7 | 88.7 | |||
| Adjustments to contingent considerations | 7.1 | 2.9 | ||||
| Transaction costs | 1.2 | 10.2 | ||||
| Fair value loss on Max option contracts | – | 20.1 | ||||
| Gain on derecognition of finance lease asset and liability | 3.4 | – | ||||
| Deferred tax raised on unrecognised exchange gain on intercompany loan/(2019: historical losses) | 9.1 | (5.5) | ||||
| Other | (1.7) | – | ||||
| Normalised EPS (cents) | (47.6) | 61.0 | 116.4 | |||
| Normalised EPS excluding amortisation (cents) | (36.5) | 94.0 | 148.1 |
The Group is in a strong financial position with net debt to normalised EBITDA as at 30 September 2020 at 2.96 times (2019: 1.96 times).
The Group negotiated amended bank covenants for the periods ended 30 September 2020 (net debt to normalised EBITDA of 4.0 times) and ending 31 March 2021 (net debt to normalised EBITDA of 4.5 times) due to the uncertainty of the pandemic. The Group agreed not to pay dividends without lender approval as part of the covenants amendment terms. The Group was well within its original bank covenant for net debt to normalised EBITDA of 3.50 times as at 30 September 2020.
The Group has implemented additional structures and processes to forecast, monitor and mitigate liquidity risks. The refinancing of the term debt in the international operations has increased the committed facilities by approximately GBP55 million.
The Group’s available undrawn bank facilities as at 30 September 2020 amounted to R6.3 billion. To ensure the Group has sufficient cash reserves, in addition to securing additional bank facilities, management has implemented a number of mitigating actions and cash preservation levers across the Group’s operations. These levers include the reduction and deferral of capital expenditure projects, suspending the interim and final dividend, placed an interim embargo on noncritical spend, reduced temporary employee costs through increased utilisation of permanent employees, negotiated extended payment terms with suppliers, and utilised government incentive programmes, as far as possible. The Group’s executive team has also agreed to defer their short-term incentives.
The Group had strong working capital management despite the challenging environment in which the Group operated. The cash generated from operations amounted to R4.6 billion, and represented 111% of normalised EBITDA pre-IFRS 16 (2019: 103%).
During the financial year under review, the Group invested approximately R2.0 billion (2019: R2.3 billion), comprised mainly of capital projects of R2.0 billion (2019: R2.1 billion) and a new acquisition (net of cash acquired) by Alliance Medical of R6.0 million. The maintenance capital expenditure for the year was R1.2 billion (2019: R1.2 billion).
The Board of directors has decided, considering the current trading conditions and in order to preserve cash, not to pay a final dividend for the year. This position will be reviewed in the new financial year.
Pieter van der Westhuizen
Chief Financial Officer