
INTEGRATED REPORT 2019
How we create value
Life
Well-being and
quality of life
health
Clinical excellence
in world-class
facilities
Care
Quality, service,
respect and
empathy for those
entrusted to
our care
For us, value means delivering these three elements to our stakeholders
We believe that our external operating environment, including economic conditions, technological change, societal issues and environmental challenges, along with the quality and nature of our stakeholder relationships form the foundation for the value we create
By analysing these spheres, and taking into account our internal business context, we can identify our risks and opportunities, from which we derive those material matters that have the most significant impact on our ability to create value in the short, medium and long term
We respond strategically to our material matters to position our business for value creation into the future
|
|
|
|


We deliver value to our stakeholders in line with our purpose of making life better
STATEMENT OF FINANCIAL VALUE ADDED
| 2019 R'm |
2018 R'm |
2017 R'm |
|||
| Revenue | 25 672 | 23 488 | 20 797 | ||
|---|---|---|---|---|---|
| Less: Purchased cost of goods and services | (13 292) | (11 936) | (10 309) | ||
| Financial value added | 12 380 | 11 552 | 10 488 | ||
| Other income1 | 1 715 | 104 | 110 | ||
| Financial wealth created | 14 095 | 11 656 | 10 598 | ||
| Employees | 6 493 | 5 976 | 5 443 | ||
| Providers of equity | 1 321 | 1 209 | 1 478 | ||
| Providers of funding2 | 1 018 | 819 | 1 216 | ||
| Governments | 1 022 | 1 095 | 976 | ||
| Maintenance and expansion of capital | 1 986 | 1 704 | 1 410 | ||
| Reinvestment in the Group3 | 2 255 | 853 | 75 | ||
| Financial wealth distributed | 14 095 | 11 656 | 10 598 | ||
| Average number of employees | 21 795 | 21 227 | 20 499 | ||
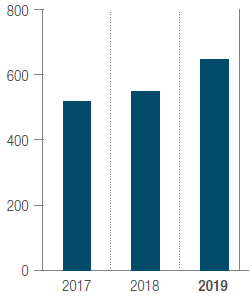
| Financial wealth created per employee (R'000) | 647 | 549 | 517 | ||
| Weighted average number of shares (million) | 1 456 | 1 451 | 1 310 | ||
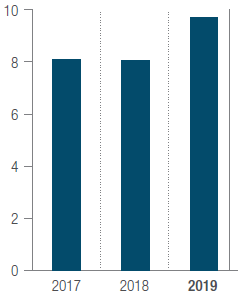
| Financial wealth created per share (R) | 9.69 | 8.03 | 8.09 | ||
| 1 | Other income in 2019 includes the profit on disposal of Max of R1.5 billion before withholding tax. |
| 2 | The increase in 2019 is mainly due to the acquisition of the equity holding of 6.22% from the Alliance Medical management for GBP35.7 million (R640 million) in June 2018, and the acquisition of the European Scanning Centre (ESC) in December 2018 for GBP10.6 million (R195 million) offset by the settlement of debt during 2019. 2017 includes R778 million of funding costs for acquisitions, of which R427 million is non-recurring due to the settlement of a portion of the bridge funding via the rights offer. |
| 3 | Includes impairment of R164 million for 2019, with R125 million related to impairment of investment in Poland and R39 million being software development costs relating to our southern Africa operations. 2018 includes impairment of R34 million, being mainly software development costs relating to the southern Africa operations. |
The Group has undertaken a strategy of international growth and diversification to support the longer-term growth of the private healthcare market. This has resulted in a number of non-recurring costs in the prior year, including transaction costs and increased acquisition funding costs. Excluding these non-recurring items the financial wealth created per employee would be R661 638 (2018: R565 468 and 2017: R556 905), and the financial wealth created per share would be R9.68 (2018: R8.04 and 2017: R8.72).
| Financial wealth created per employee (R’000) | Financial wealth created per share (R) | |
 |
 |