
INTEGRATED REPORT 2019
Implementation report
REMUNERATION IMPLEMENTATION REPORT
Introduction
Remuneration offered in year under review
This implementation report discloses the remuneration outcomes for executive directors for the 2019 financial year.
Fair and responsible pay
- The board remuneration and HR committee ensures, on an ongoing basis, that the organisation remunerates fairly, responsibly and transparently so as to promote the achievement of strategic objectives and positive outcomes in the short, medium and long term.
- To this end, the Group executive holds management accountable for ensuring that total remuneration is distributed fairly and ensures appropriate oversight; and where differentials exist, that they can be reasonably explained.
- The board remuneration and HR committee is committed to ensuring the remuneration of executive management is fair and responsible in the context of overall employee remuneration.
- The increases in annual guaranteed packages granted in January 2019 are set out in the table below:
| Guaranteed pay % increase |
||
| Group executives | 5.2 | |
|---|---|---|
| Senior executives and top management | 5.1 | |
| Core staff | 6.1 | |
| Other staff | 6.0 | |
- The Company performed a thorough benchmarking exercise during May/June 2019 and market realities revealed a lag in the remuneration of the Group CEO and Group CFO. The board remuneration and HR committee agreed to adjust the Group CEO's remuneration to market median and the Group CFO's remuneration to the 75th percentile. The rationale for these increases is explained under 'Guaranteed Package' in our remuneration report.
- As advised in the previous year's remuneration report, the CEO invested R3 million in Life Healthcare shares as agreed on appointment. The Company matched the investment with the purchase of shares to the value of R9 million. The matched shares are restricted with vesting occurring over three years, conditional on continued service with the Company. The first vesting of one-third occurred on 1 February 2019. The CSDP sold 337 096 Life Healthcare shares, which were transferred to the Group CEO's personal trading account at an issue price of R26.46. The next vesting will occur on 1 February 2020, and the final vesting on 1 February 2021.
- Malus and clawback clauses are to be included in the rules and policies of both the short- and long-term incentive schemes for the Group executive as referred to in the remuneration report, with effect from FY2020.
- All individuals are subject to the Company's standard terms and conditions of employment, specifically as they relate to the employment contract and conditions relating to termination.
The implementation report sets out Life Healthcare's reward design, executive targets per performance measure, actual performance outcomes, the corresponding value of the award opportunity, and actual payment of all variable incentives.
REMUNERATION OUTCOMES – TOTAL REMUNERATION
Total remuneration outcomes for the current and prior financial years for the executive directors are tabulated below. Explanatory footnotes are provided where necessary.
As the appointment of the International CEO was effective 1 June 2019, no comparison to the prior year can be made.
GROUP CEO – Dr S Viranna
Commenced employment as Group CEO: 1 February 2018.
FY2018 not full year of assessment.
| Remuneration annualised | Actual remuneration | ||||||||||
| R'000 | Annual TCTC | STI perfor-mance bonus | Total annual compen-sation | Actual TCTC** |
Actual STI perfor-mance bonus | Total annual compen-sation | LTIP expected value | One-third Company matched shares vested | Total remune-ration | ||
| 90% | 90% | ||||||||||
| Min 2019 | 6 199 | 6 199 | 6 199 | 6 199 | 6 199 | ||||||
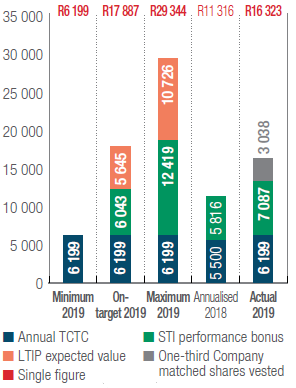
| On-target 2019 | 6 199 | 6 043 | 12 242 | 6 199 | 6 043 | 12 242 | 5 645 | 17 887 | |||
| Max 2019 | 6 199 | 12 419 | 18 618 | 6 199 | 12 419 | 18 618 | 10 726 | 29 344 | |||
| Actual 2018 | 5 500 | 5 816 | 11 316 | 3 764 | 3 878 | 7 642 | – | 7 642 | |||
| Actual 2019 | 6 199 | 7 087 | 13 285 | 6 199 | 7 087 | 13 285 | – | 3 038 | 16 323 | ||
| Year-on-year growth | 12.7% | 21.8% | 17.4% | ** | 83% | 74% | |||||
TCTC – Total cost to company
| Group CEO – Dr S Viranna (R’000) | |
 |
Interim adjustment was granted in July 2019.
As only eight months actual TCTC was paid for FY2018, the value has been annualised in order to compare year-on-year remuneration. ** The effective increase on annualised CTC is 12.7%. The graph reflects annualised CTC for FY2018.
The Group CEO purchased R3 million worth of Life Healthcare shares after the restrictions of the closed period lifted.
The Company matched with a purchase of R9 million restricted years (337 096 shares @ issue price of R26.46). These will vest to the Group CEO in three tranches over a period of three years. The first vesting occurred on 1 February 2019 – gross value R3 038 050.
Group CFO – P van der Westhuizen
| R'000 | Annual TCTC | STI perfor-mance bonus | Total annual compen-sation | LTIP expected value | Outperfor-mance bonus | Total remune-ration | |
| 65.0% | 80.0% | ||||||
| Min 2019 | 4 391 | 4 391 | 4 391 | ||||
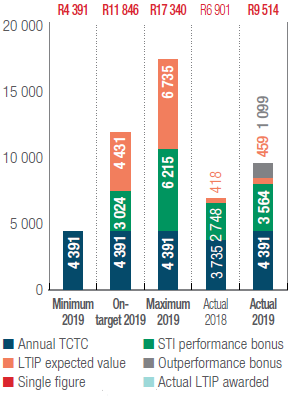
| On-target 2019 | 4 391 | 3 024 | 7 415 | 4 431 | 11 846 | ||
| Max 2019 | 4 391 | 6 215 | 10 606 | 6 735 | 17 340 | ||
| Actual 2018 | 3 735 | 2 748 | 6 483 | 418 | 6 901 | ||
| Actual 2019 | 4 391 | 3 564 | 7 955 | 459 | 1 099 | 9 514 | |
| Year-on-year growth | 17.6% | 30% | 23% | 10% | 38% |
| Group CFO – P van der Westhuizen (R’000) | |
 |
Interim adjustment to guaranteed package granted in July 2019.
STI percentage targeted reward increased from 57.5% to 65% with effect from 1 January 2019.
An additional outperformance bonus of R1 099 000 was awarded at the end of February 2019 as detailed below, under 'Other incentive schemes'.
CEO SA – A Pyle
Commenced employment as SA CEO: 1 July 2018.
FY2018 not full year of assessment.
| Remuneration annualised | Actual remuneration | |||||||||
| R'000 | Annual TCTC | STI perfor-mance bonus | Total annual compen-sation | Actual TCTC** | STI perfor-mance bonus | Total annual compen-sation | LTIP expected value | Total remune-ration | ||
| 57.5% | 70.0% | |||||||||
| Min 2019 | 3 747 | 3 747 | 3 747 | – | 3 747 | 3 747 | ||||
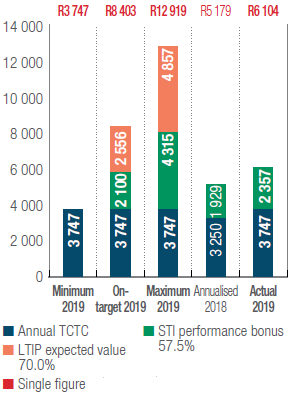
| On-target 2019 | 3 747 | 2 100 | 5 847 | 3 747 | 2 100 | 5 847 | 2 556 | 8 403 | ||
| Max 2019 | 3 747 | 4 315 | 8 062 | 3 747 | 4 315 | 8 062 | 4 857 | 12 919 | ||
| Actual 2018 | 3 250 | 1 929 | 5 179 | 979 | 482 | 1 461 | – | 1 461 | ||
| Actual 2019 | 3 747 | 2 357 | 6 104 | 3 747 | 2 357 | 6 104 | – | 6 104 | ||
| Year-on-year growth | 15.3% | 22.2% | 17.9% | ** | 389% | 318% | 318% | |||
| ** | Only appointed as CEO – SA with effect 1 July 2018, thus Actual FY2018 remuneration and STI is only based on three months' salary. FY2018 has been annualised to compare year-on-year remuneration. The effective increase on annual TCTC is 15.3%. |
| CEO SA – A Pyle (R’000) | |
 |
No LTI has been awarded as permanent tenure is too short. A Pyle was in a contract position as investor relations executive, and became permanent on 1 January 2017.
The graph reflects annualised CTC for FY2018.
CEO International – M Chapman
| Actual remuneration | |||||||||
| R'000 | Annualised TCTC | Actual TCTC | STI perfor-mance bonus | Total annual compen-sation | LTIP expected value | Outperfor-mance bonus | Total remune-ration | ||
| – | 57.5% | 60.0% | |||||||
| Min 2019 | 5 777 | 1 910 | – | 1 910 | – | 1 910 | |||
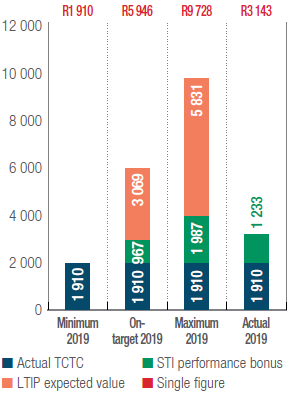
| On-target 2019 | 5 777 | 1 910 | 967 | 2 877 | 3 069 | 5 946 | |||
| Max 2019 | 5 777 | 1 910 | 1 987 | 3 897 | 5 831 | 9 728 | |||
| Actual 2018 | – | – | – | – | – | – | |||
| Actual 2019 | 5 777 | 1 910 | 1 233 | 3 143 | – | – | 3 143 | ||
| International CEO – M Chapman (R’000) | |
 |
Appointed as CEO International from 1 June 2019.
Converted to rand applying the average exchange rate for FY2019 of 1GBP = R18.34.
Remuneration (TCTC and STI based on role as CEO – International against targets for same period, ie four months).
REMUNERATION OUTCOMES – SINGLE FIGURE
2018 and 2019 total remuneration outcomes are compared to the 2019 target pay mix and a single figure derivation on a name and role basis for the previous year and the year under review.
All figures in below reflected in R'000
Bonuses are actual bonuses paid in the 2019 financial year, however, portions thereof are attributed to rewards earned in the previous year. Similarly, H2 2019 bonus earnings will reflect as actual bonuses paid in the FY2020 implementation report. Short-term incentives earned in FY2019 versus FY2018 are detailed in the bonus section of this report.
Total earnings – actual paid
| Dr Shrey Viranna Group CEO |
Pieter van der Westhuizen Group CFO |
Adam Pyle CEO SA |
Mark Chapman CEO International |
|||||||||||||||||||||||||
| FY 2018 | FY 2019 | % Increase | FY 2018 | FY 2019 | % Increase | FY 2018 | FY 2019 | % Increase | FY 2018 | FY 2019 | % Increase | |||||||||||||||||
| Salaries | 3 485 | 5 887 | 3 486 | 4 084 | 2 288 | 3 374 | – | 1 910 | ||||||||||||||||||||
|---|---|---|---|---|---|---|---|---|---|---|---|---|---|---|---|---|---|---|---|---|---|---|---|---|---|---|---|---|
| Other allowances | 112 | 33 | 64 | 95 | 6 | 194 | – | – | ||||||||||||||||||||
| Med aid contributions | 21 | 32 | 35 | 37 | 38 | 37 | – | – | ||||||||||||||||||||
| Retirement fund contributions | 146 | 247 | 149 | 174 | 90 | 142 | – | – | ||||||||||||||||||||
| Guaranteed package | 3 764 | 6 199 | 64.7% | 3 735 | 4 391 | 17.6% | 979 | 3 747 | 282.9 | 1 910 | ||||||||||||||||||
| Acting allowance | 2 500 | |||||||||||||||||||||||||||
| Long-service award | 5 | |||||||||||||||||||||||||||
| Performance bonus | – | 6 501 | 880 | 5 100 | 702 | 1 469 | – | – | ||||||||||||||||||||
| Gains on ltip | – | 3 038 | 418 | 872 | – | – | – | – | ||||||||||||||||||||
| Total remuneration | 3 764 | 15 738 | 318.1% | 7 532 | 10 368 | 37.7% | 1 680 | 5 217 | 210.5 | – | 1 910 | |||||||||||||||||
| Notes |
|
|
|
|
||||||||||||||||||||||||
| ** Outperformance bonus paid to the Group CFO is detailed under "Other incentive schemes". | ||||||||||||||||||||||||||||
REMUNERATION OUTCOMES – 2018/2019 VARIABLE COMPENSATION PLAN (VCP) OUTCOMES
Financial and non-financial outcomes achieved by Life Healthcare are presented below. VCP outcomes are measured at the end of every six (6) month period in the financial year. For the Company rating, cash flow ratings are capped at a rating of seven during the first six (6) months of the financial year. An adjustment is effected in the second half of the financial year to reflect the final year-end cash flow rating.
Financial outcomes
| H1 | H2 | Total FY | |||||||||||||||||
| Measure | % weighting |
Target | Actual | % achieved |
Score | Target | Actual | % achieved |
Score | Target | Actual | % achieved |
Score | ||||||
| Group | |||||||||||||||||||
| FY2019 | |||||||||||||||||||
| Group EBITA | 70 | 2 158 | 2 065 | 96 | 5.00 | 2 430 | 2 325 | 96 | 5.00 | 4 588 | 4 390 | 96 | 5.00 | ||||||
| Group working capital management | 30 | (222) | (232) | 96 | 5.00 | 22 | 340 | 1 545 | 10.00 | (200) | 108 | 154 | 10.00 | ||||||
| Score (adjusted cash flow at year-end) | 5.00 | 6.50 | 6.50 | ||||||||||||||||
| Target | 5.00 | 5.00 | |||||||||||||||||
| % award | 100 | 135 | |||||||||||||||||
| FY2018 | |||||||||||||||||||
| Group operating profit | 70 | 1 863 | 1 770 | 95 | 4.75 | 2 139 | 2 084 | 98 | 5.25 | 4 002 | 3 854 | 96 | 5.25 | ||||||
| Group working capital management | 30 | (222) | (232) | 96 | 5.00 | 23 | 329 | 1 430 | 10.00 | (199) | 97 | 205 | 10.00 | ||||||
| Score (adjusted cash flow at year-end) | 5.00 | 6.75 | 6.75 | ||||||||||||||||
| Target | 5.00 | 5.00 | |||||||||||||||||
| % award | 100 | 100 | |||||||||||||||||
| SA | |||||||||||||||||||
| FY2019 | |||||||||||||||||||
| SA operating profit | 70 | 1 855 | 1 735 | 94 | 4.50 | 2 071 | 1 984 | 96 | 5.00 | 3 926 | 3 719 | 95 | 4.75 | ||||||
| SA working capital generated/(utilised) | 30 | (218) | (216) | 99 | 5.75 | 10 | 341 | 3 410 | 10.00 | (208) | 125 | 166 | 10.00 | ||||||
| Score (adjusted cash flow at year-end) | 5.00 | 6.50 | 6.50 | ||||||||||||||||
| Target | 5.00 | 5.00 | |||||||||||||||||
| % award | 100 | 135 | |||||||||||||||||
| FY2018 | |||||||||||||||||||
| Operating profit | 70 | 2 137 | 2 218 | 104 | 6.25 | 2 423 | 2 299 | 95 | 4.75 | 4 560 | 4 517 | 99 | 5.75 | ||||||
| Debtors days | 24 | 41 | 41 | 99 | 5.75 | 38 | 42 | 91 | 3.75 | 79 | 83 | 105 | 6.50 | ||||||
| Stock | 5 | 1.0 | 0.9 | 112 | 7.00 | 0.81 | 0.83 | 98 | 5.50 | 1.82 | 1.72 | 106 | 6.50 | ||||||
| Score (adjusted cash flow at year-end) | 6.25 | 4.50 | 6.00 | ||||||||||||||||
| Target | 5.00 | 5.00 | |||||||||||||||||
| % award | 130 | 85 | |||||||||||||||||
| International | |||||||||||||||||||
| FY2019 | |||||||||||||||||||
| International operating profit | 70 | 301 | 329 | 109 | 6.75 | 367 | 391 | 106 | 6.50 | 668 | 719 | 108 | 6.75 | ||||||
| International working capital | 30 | (4) | (16) | 400 | 10.00 | 13 | 0 | 95 | 5.00 | 9 | (16) | (178) | 0 | ||||||
| Score (adjusted cash flow at year-end) | 8.50 | 6.25 | 6.75 | ||||||||||||||||
| Target | 5.00 | ||||||||||||||||||
| % award | 185 | 130 | |||||||||||||||||
NON-FINANCIAL OUTCOMES
Performance outcomes are reflected for the full year. Life Healthcare sets specific and measurable milestones every six months, designed such that delivery against individual milestones positions the Company for full year delivery against overall objectives. H1 and H2 scores are determined by delivery against these performance milestones.
| FY2019 Non-financial measures | |||||||||||||
| H1 | H2 | ||||||||||||
| Performance metric | Weighting | Measure | Target | Score | % award |
Score | % award |
Performance outcome | |||||
| Clinical metrics | 10% |
|
4.00 | 4.00 | 100 | 4.00 | 100 |
|
|||||
|---|---|---|---|---|---|---|---|---|---|---|---|---|---|
| Strategic innovation | 10% |
|
4.00 | 4.00 | 100 | 4.00 | 100 |
|
|||||
| People | 10% |
|
4.00 | 4.00 | 100 | 6.00 | 140 |
|
|||||
| Total | 4.00 | 4.00 | 100 | 5.00 | 120 | ||||||||

REMUNERATION OUTCOMES – 2018/2019 VARIABLE COMPENSATION PLAN (VCP) OUTCOMES IN DETAIL
The results of performance against measures in each executive's scorecard are disclosed below in such a way that the stakeholder can reasonably assess whether the incentive is in line with performance outcomes as well as the remuneration policy.
Although measured and paid bi-annually, annual VCP payments per executive are summarised below. The percentage achievement reflected is the total percentage of on-target performance achieved. Executives are measured proportionate to the period in their roles.
| Shrey Viranna On-target STI bonus at 90% of TCTC FY2019 |
Pieter van der Westhuizen On-target STI bonus at 65% of TCTC FY2019 |
||||||||||
| Performance metric | Weighting % |
Reward % H1 |
Reward % H2 |
Weighted rewards % |
VCP payment R'000 |
Weighting % |
Reward % H1 |
Reward % H2 |
Weighted rewards % |
VCP payment R'000 |
|
| Financial performance | |||||||||||
| Group | 70% | 100% | 135% | 120% | 5 068 | 70% | 100% | 135% | 120% | 2 551 | |
| SA | |||||||||||
| International | |||||||||||
| Non-financial performance | 30% | 100% | 120% | 111% | 2 018 | 30% | 100% | 120% | 112% | 1 014 | |
| Total | 7 087 | 3 564 | |||||||||
| FY2018 (Only eight months in role as Group CEO) |
FY2018 (Measured and paid based on full year results) |
||||||||||
| Financial performance | |||||||||||
| Group | 50% | 115% | 1 898 | 70% | 115% | 1 517 | |||||
| SA | |||||||||||
| International | |||||||||||
| Non-financial performance | 50% | 120% | 1 980 | 30% | 140% | 1 231 | |||||
| Total | 3 878 | 2 748 | |||||||||
| Adam Pyle On-target STI bonus at 57.5% of TCTC FY2019 |
Mark Chapman On-target STI bonus at 57.5% of TCTC FY2019 |
||||||||||
| Performance metric | Weighting % |
Reward % H1 |
Reward % H2 |
Weighted rewards % |
VCP payment R'000 |
Weighting % |
Reward % H1 |
Reward % H2 |
Weighted rewards % |
VCP payment R'000 |
|
| (Only four months in role as CEO International reflected) | |||||||||||
| Financial performance | |||||||||||
| Group | 10% | 100% | 135% | 117% | 247 | 10% | 135% | 135% | 131 | ||
| SA | 60% | 90% | 135% | 112% | 1 417 | ||||||
| International | 60% | 130% | 130% | 754 | |||||||
| Non-financial performance | 30% | 100% | 120% | 110% | 693 | 30% | 120% | 120% | 348 | ||
| Total | 2 357 | 1 233 | |||||||||
| FY2018 (Only three months in role as CEO SA reflected) |
|||||||||||
| Financial performance | |||||||||||
| Group | 15% | 115% | 115% | 81 | |||||||
| SA | 60% | 85% | 85% | 238 | |||||||
| International | |||||||||||
| Non-financial performance | 25% | 140% | 140% | 164 | |||||||
| Total | 482 | ||||||||||
REMUNERATION OUTCOMES – HISTORY OF RECENTLY VESTED AND UNVESTED SHARES
The LTI details regarding 2014 to 2016 allocations pertain to the Group CFO only. The CEO SA received his first LTI allocation in January 2017 when he was made permanent. Based on tenure in role, the other executives only qualify for the LTI once-off restricted cash offer and the LTI 2019 allocation.
- The legacy Life Healthcare 2013 long-term incentive plan allowed individuals to elect, at the time of the 2013 and 2014 allocations, to defer the vesting of their shares for a further two years (from three to five) and have those shares matched with additional restricted shares. The final 2014 co-investment and matched shares vested at the end of January 2019. This allocation is now closed with no further payments due.
- Life Healthcare acquired the Alliance Medical Group in 2016 and financed the acquisition via a rights issue offer. LTIP participants were offered the opportunity to follow their rights on co-invested shares held in the LTIP trust and where participants elected to follow rights and paid for these additional shares, the Company followed the rights on matched shares held in the trust. Shares so acquired were subject to the same restrictions that were applicable to the matched and co-invested shares held in the trust.
- The Life Healthcare 2015 long-term incentive plan offered notional performance shares in 2015, 2016 and 2017.
- As advised in last years' implementation report, the three-year vesting period resulted in no payment in respect of the vesting of the 2015 allocation.
- The vesting of the 2016 allocation occurred at the end of January 2019. Performance against both TSR and EBIT measures for the period 1 January 2016 to 31 December 2018 did not meet threshold levels and thus yielded no payment to participants; details of which are set out below.
- The next vesting of the 2017 allocation occurs at the end of December 2019 and will be reported in the 2020 implementation report.
LTIP 2016 Allocation – Outcome of performance against vesting criteria
| PERFORMANCE MEASURE | WEIGHTING | OUTCOME | THRESHOLD | RESULT | ||||||||||
| Actual TSR compared to a comparator group of companies | 50% | Life Healthcare ranked at 42nd percentile | 50th percentile | No payment | ||||||||||
| Actual EBIT growth compared to a composite inflation rate (taking into account all countries) | 50% |
|
CPI + 1% | No payment |
- As a result of the rights offer in March 2017 and according to the rules of the LTIP scheme, an adjustment was made to the LTIP 2015, 2016 and 2017 scheme allocations to ensure that participants were in the same economic position that they were in prior to the occurrence of the event. This change was effected in terms of the rules of the LTIP scheme. Adjustment is reflected in the summary of holdings in the table below.
- Life Healthcare could not make the 2018 offer in terms of the 2015 long-term incentive plan allocation, as the Company entered an extended closed period in November 2017. Accordingly, the Company made an alternative once-off long-term restricted cash offer, the details of which were described in the 2018 remuneration report. Payment of the scheme will only be made in January 2021.
- The 2019 LTIP allocation was made with effect 1 January 2019 and notional performance shares were granted to the executive.
Summary of total performance shares per executive
| Share allocation | Rights issue | ||||||||
| LTIP scheme | LTIP scheme | Share allocation |
Offer price R |
Co- invest- ment shares |
Matched shares |
Performance shares | Offer price R |
Investment shares purchased by executive | |
| LTIP 2009 Scheme | P van der Westhuizen | 01 Jan 14 | 35.05 | 7 381 | 12 509 | 24.50 | 2 526 | ||
| SB Viranna | 01 Jan 19 | 25.86 | 235 992 | ||||||
| LTIP 2015 Scheme | P van der Westhuizen | 01 Jan 16 | 34.58 | 40 620 | |||||
| 01 Jan 17 | 31.59 | 65 380 | |||||||
| 01 Jan 19 | 25.86 | 220 803 | |||||||
| A Pyle | 01 Jan 17 | 31.59 | 34 126 | ||||||
| 01 Jan 19 | 25.86 | 114 969 | |||||||
| M Chapman | 01 Jan 19 | 25.86 | 127 191 | ||||||
| Rights issue | Vested 1 February 2019 | Balance as at 30 September 2019 | |||||||||
| LTIP scheme | Adjust- ment co-matched shares |
Adjust- ment to performance shares |
Vesting date | Number of shares | Price at exercise date R |
Number of shares | Allocation value R |
Value based on 30 September 2019 share price | |||
| LTIP 2009 Scheme | P van der Westhuizen | 4 280 | 01 Feb 19 | 26 696 | R27.24 | ||||||
|---|---|---|---|---|---|---|---|---|---|---|---|
| SB Viranna | 31 Dec 21 | 235 992 | 6 103 300 | 5 352 299 | |||||||
| LTIP 2015 Scheme | P van der Westhuizen | 8 679 | 31 Dec 18 | 49 299 | R0.00 | ||||||
| 13 970 | 31 Dec 19 | 79 350 | 2 506 667 | 1 799 658 | |||||||
| 31 Dec 21 | 220 803 | 5 710 477 | 5 007 812 | ||||||||
| A Pyle | 7 292 | 31 Dec 19 | 41 418 | 1 308 395 | 939 360 | ||||||
| 31 Dec 21 | 114 969 | 2 973 365 | 2 607 497 | ||||||||
| M Chapman | 31 Dec 21 | 127 191 | 3 289 454 | 2 884 692 | |||||||
REMUNERATION OUTCOMES – OTHER INCENTIVE SCHEMES
As detailed in our 2018 remuneration report, the outperformance incentive scheme was introduced in FY2018 to secure the Company's key talent by incentivising superior business and personal performance. The scheme runs annually for two years, and the first payment was made at the end of February 2019.
This scheme is performance-based on the outcomes of the short-term incentive scheme as well as an assessment of a scorecard of critical sustainability measures. Specifically: actual bonuses generated as outcomes in the short-term incentive plan (VCP) are matched with a further 40% component, which matching component is subject to a modifier between 50% and 150%, based on an assessment of the following (equally weighted) critical sustainability measures:
- Personal performance rating
- Demonstrated innovation
- Talent retention index
- Values promotion
The Group CEO and International CEO were excluded from participation in this scheme as senior management needed to be in service from 1 January 2016 to be eligible for participation. The Group CFO scored 4.24 on assessment of these measures by the Group CEO. This resulted in 100% payment of on-target reward of R1 099 236 earned in FY2018. The threshold and maximum potential award table as well as the respective payment made to the Group CFO at the end of February 2019 are indicated below:
| Score | % award |
||
| Threshold | 2 | 50 | |
|---|---|---|---|
| On-target | 4 | 100 | |
| Outperformance | 7 | 150 | |
| Score | % award |
Outperfor-mance bonus | |||
| P van der Westhuizen | Group CFO | 4.24 | 100 | 1 099 236 | |
|---|---|---|---|---|---|
The CEO-SA will be eligible for participation (pending performance outcomes) for the FY2020 payment.