Currently viewing: Group Chief Financial Officer's review / Next: International business review
Life Healthcare’s 2021 financial year has incorporated a full 12 months of COVID-19-related effects, including two severe COVID-19 waves which severely disrupted trading for the Group.

Pieter van der Westhuizen
Group Chief Financial Officer (CFO)
GROUP REVENUE
increased by
12.7% to
R26.9 BILLION
increased by
12.7% to
R26.9 BILLION
Normalised EBITDA increased
by 21.6% to
R5.1 BILLION
by 21.6% to
R5.1 BILLION
Our primary focus throughout the pandemic has been to ensure that we continue to deliver a safe environment providing quality care for our patients while also protecting the health, safety and job security of our employees. Early on in the pandemic we curtailed a number of projects across the business so as to preserve cash and maintain liquidity.
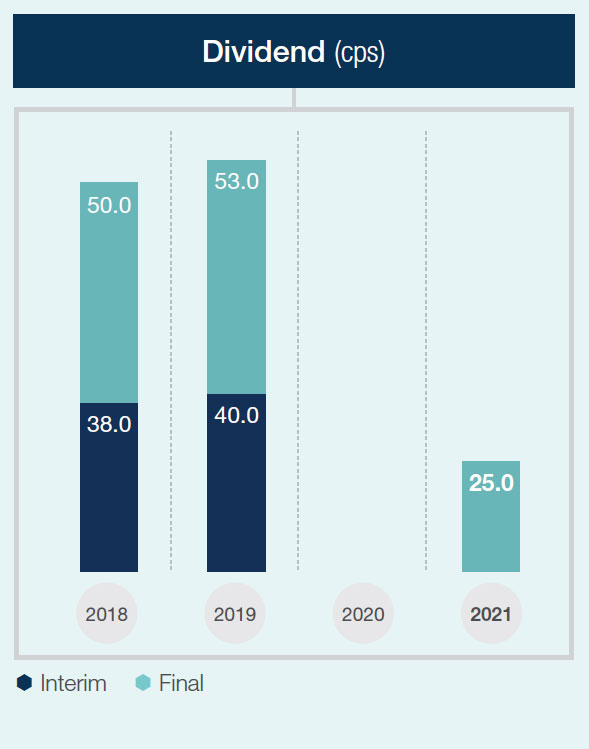
This included not making distributions to shareholders during our 2020 financial year or after our interim results for the six months to 31 March 2021.
As the business adjusted to the new operating conditions within a COVID-19 environment, we applied lessons learned early on in the pandemic, and have seen a pleasing improvement in trading performance, profitability and cash generation. This has enabled us to resume a number of capital projects which will drive revenue growth in years to come, and we are pleased to announce that the Board has approved a final distribution of 25 cents per share.
Group revenue from continuing operations, for the year ended 30 September 2021, increased by 12.7% to R26.9 billion (2020: R23.9 billion). Group normalised EBITDA increased by 21.6% to R5.1 billion (2020: R4.2 billion) resulting in our normalised EBITDA margin expanding to 18.8% (2020: 17.4%). Normalised EBITDA grew as a result of an excellent performance from AMG and improved trading conditions and better cost management within our southern African operations.
We concluded the disposal of Scanmed S.A. (Scanmed) in Poland on 26 March 2021, realising R681 million in net proceeds. Scanmed has been presented as a discontinued operation in the current and prior period results. As a result, the prior period results have been re-presented.
What follows is a summary of our financial results for the 2021 year under review. Our full audited financial results can be found within in the 2021 Annual Financial Statements which are located on our website (www.lifehealthcare. co.za/investor-relations/results-and-reports). We also show a seven-year summary of key financial results and metrics in the Seven-year performance review.
SUMMARISED FINANCIALS
| Indicator | 2021 R’m |
2020 R’m |
% change |
| Revenue from continuing operations | 26 885 | 23 851 | 12.7 |
|---|---|---|---|
| Normalised EBITDA1 from continuing operations | 5 051 | 4 155 | 21.6 |
| Operating profit from continuing operations | 2 980 | 2 121 | 40.5 |
| Net finance cost | (622) | (793) | (21.6) |
| Share of associate’s net profit after tax | 25 | 14 | 78.6 |
| Tax expense | (642) | (556) | 15.5 |
| Profit from continuing operations | 1 767 | 837 | >100 |
| Profit/(loss) from discontinued operation | 87 | (799) | n/a |
| Profit for the year | 1 854 | 38 | n/a |
| Profit attributable to ordinary equity holders | 1 754 | (93) | n/a |
| 1 | Life Healthcare defines normalised EBITDA as operating profit before depreciation on property, plant and equipment, amortisation of intangible assets and non-trading related costs and income. |
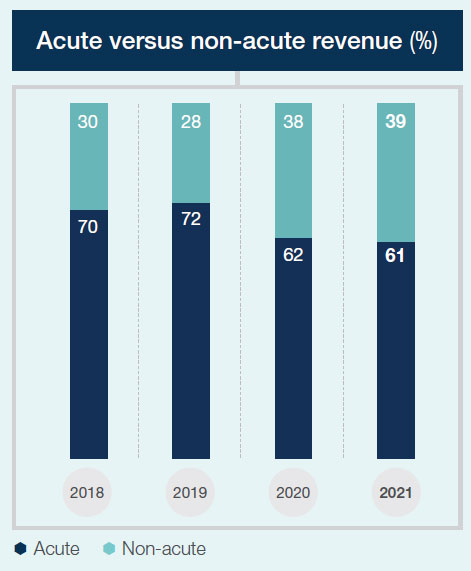
We continue to make progress with our strategic goal of growing revenue and profit from non-acute services.
| Indicator | 2021 R’m |
2020 R’m |
Year-on-year trend |
| Growth | |||
| Net debt to normalised EBITDA (ratio) | 1.82 | 2.96 |  |
| Interest cover (ratio) | 11.0 | 5.8 |  |
| HEPS (cps) | 111.1 | 48.7 | |
| Dividend (cps) | 25 | – | |
| Cash generated from operations | 5 687 | 4 562 | |
| Efficiency | |||
| Normalised EBITDA margin (%) | 18.8 | 17.4 | |
| Cash generated from operations as percentage of EBITDA | 112.6 | 109.8 | |
REVENUE AND NORMALISED EBITDA
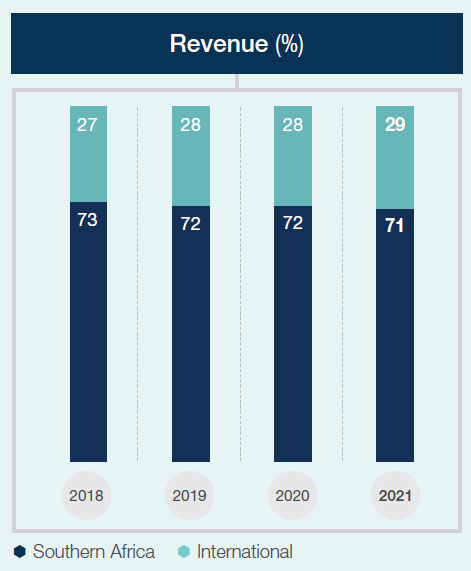
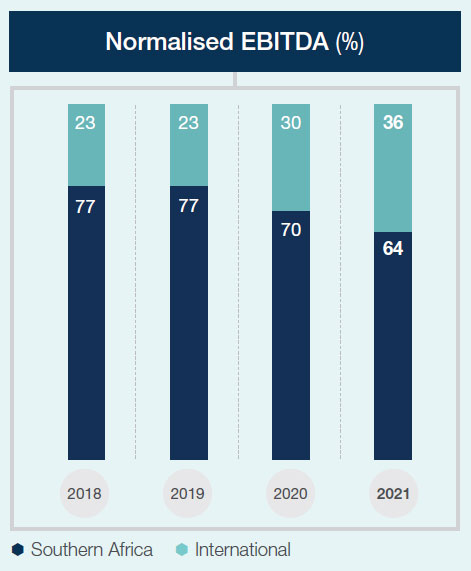
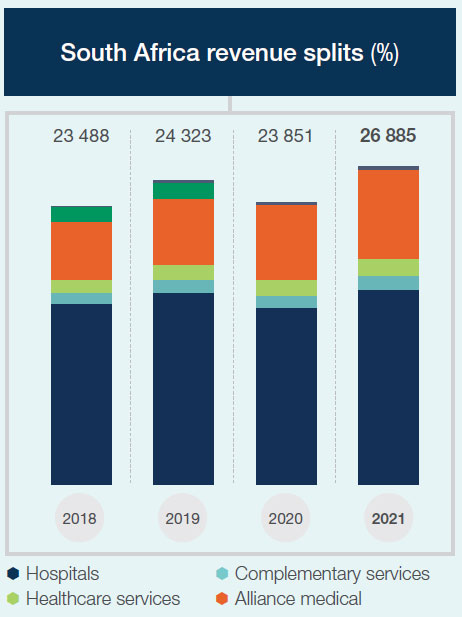
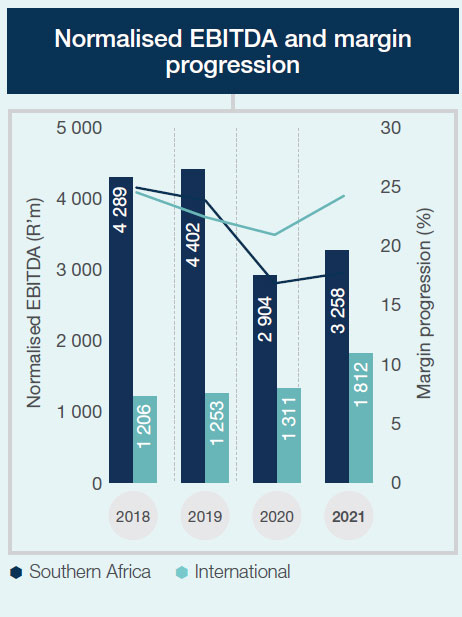
Our international segment (see International business review) saw revenue from continuing operations increasing by 18.9% to R7.5 billion (2020: R6.3 billion). Normalised EBITDA from continuing operations grew by 38.2% to R1.8 billion (2020: R1.3 billion) and the normalised EBITDA margin expanded to 24.2% (2020: 20.9%).
Our southern African operations (see Southern African business review) delivered an increase in revenue of 10.3% to R19.0 billion (2020: R17.2 billion). Normalised EBITDA grew by 12.2% to R3.3 billion (2020: R2.9 billion) and the normalised EBITDA margin expanded to 17.1% (2020: 16.8%).
Our growth initiatives saw a 21.3% increase in revenue to R388 million (2020: R320 million) and a normalised EBITDA loss of R19 million largely met the objective of breaking even at normalised EBITDA level.
 More on our growth initiatives
see
EARNINGS PER SHARE (EPS)
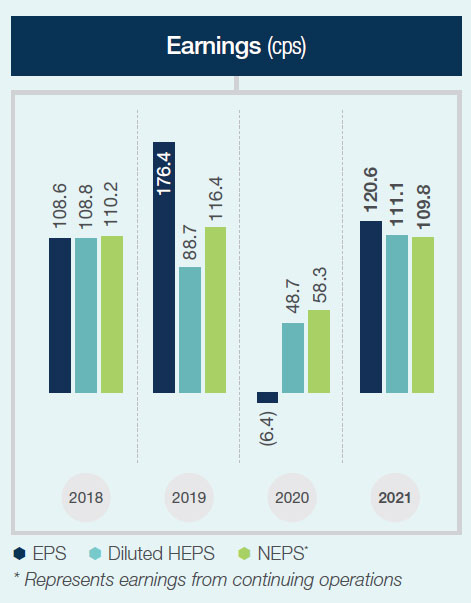
EPS increased by more than 100% to 120.6 cps (2020: a loss of 6.4 cps). This is due to the weak H2-2020 performance after the onset of the COVID-19 pandemic and restrictive lockdowns, as well as the impairment of R793 million in the 2020 year relating to Scanmed, which reduced EPS by 54.5 cps.
NORMALISED EPS (NEPS),
which excludes non-trading related items,
increased by 84.7% to
112.7 cps
61.0 cps in 2020
and NEPS from
CONTINUING OPERATIONS
increased by 88.3% to
109.8 cps
58.3 cps in 2020
which excludes non-trading related items,
increased by 84.7% to
112.7 cps
61.0 cps in 2020
and NEPS from
CONTINUING OPERATIONS
increased by 88.3% to
109.8 cps
58.3 cps in 2020
The 2021 results benefited from an improved operating performance as well as the profit from Scanmed (which increased EPS +6 cps).
EPS from continuing operations (excluding Scanmed) increased by more than 100% to 114.6 cps (2020: 48.5 cps).
HEPS from continuing operations increased by more than 100% to 111.1 cps (2020: 48.7 cps).
Normalised EPS (NEPS), which excludes non-trading related items, increased by 84.8% to 112.7 cps (2020: 61.0 cps) and NEPS from continuing operations increased by 88.3% to 109.8 cps (2020: 58.3 cps).
RECONCILIATION OF HEADLINE EARNINGS (HEPS) AND NORMALISED EARNINGS (NEPS)1
| Indicator | 2021 R’m |
2020 R’m |
% change | 2021 cps |
2020 cps |
% change |
| Weighted average number of shares at the end of the year (millions) | 1 454 | 1 455 | (0.1) | |||
|---|---|---|---|---|---|---|
| Profit/(loss) attributable to ordinary equity holders | 1 754 | (93) | n/a | 120.6 | (6.4) | n/a |
| (Profit)/loss from discontinued operation attributable to ordinary equity holders | (87) | 799 | (6.0) | 54.9 | ||
| Profit from continuing operations attributable to ordinary equity holders | 1 667 | 706 | 136.1 | 114.6 | 48.5 | 136.3 |
| Adjustments (net of tax and noncontrolling interest): | ||||||
| Impairment of assets and investments | 14 | 5 | 0.9 | 0.3 | ||
| Profit on remeasuring previously held interest in associate to fair value | (28) | – | (1.9) | – | ||
| Loss on disposal of property, plant and equipment | 10 | 3 | 0.7 | 0.2 | ||
| Headline earnings from continuing operations | 1 663 | 714 | 132.9 | 114.3 | 49.0 | 133.3 |
| Retirement benefit asset and postemployment medical aid income | (24) | (23) | (1.7) | (1.6) | ||
| Gain on derecognition of lease asset and liability | – | (50) | – | (3.4) | ||
| Transaction costs relating to acquisitions and disposals | 3 | 8 | 0.2 | 0.6 | ||
| Unwinding of contingent consideration | 62 | 66 | 4.3 | 4.5 | ||
| Fair value loss on equity investment | 12 | – | 0.8 | – | ||
| Deferred tax raised on unrecognised exchange gain on inter-company loan | – | 133 | – | 9.2 | ||
| Deferred tax raised previously not recognised and effective tax rate change | (118) | – | (8.1) | – | ||
| Normalised earnings from continuing operations | 1 598 | 848 | 88.4 | 109.8 | 58.3 | 88.3 |
| Normalised earnings from discontinued operation2 | 42 | 40 | 5.0 | 2.9 | 2.7 | 7.4 |
| Normalised earnings from continuing and discontinued operations | 1 640 | 888 | 84.7 | 112.7 | 61.0 | 84.8 |
| 1 Non-IFRS measure. | ||||||
| 2 Calculated as follows (refer note 27): | ||||||
| Profit/(loss) after tax from discontinued operation | 33 | (799) | ||||
| Fair value adjustments to contingent consideration | 9 | 37 | ||||
| Transaction costs | – | 9 | ||||
| Impairment of investment | – | 793 | ||||
| 42 | 40 |
FINANCIAL POSITION AND LIQUIDITY
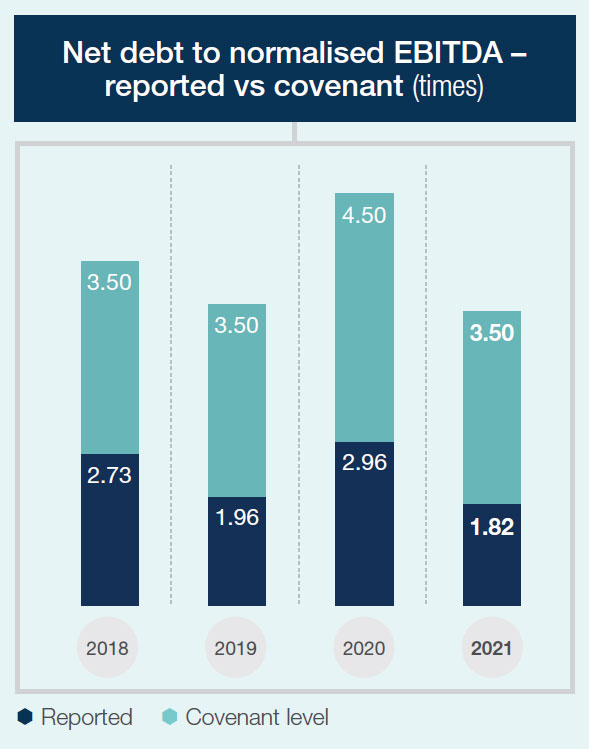
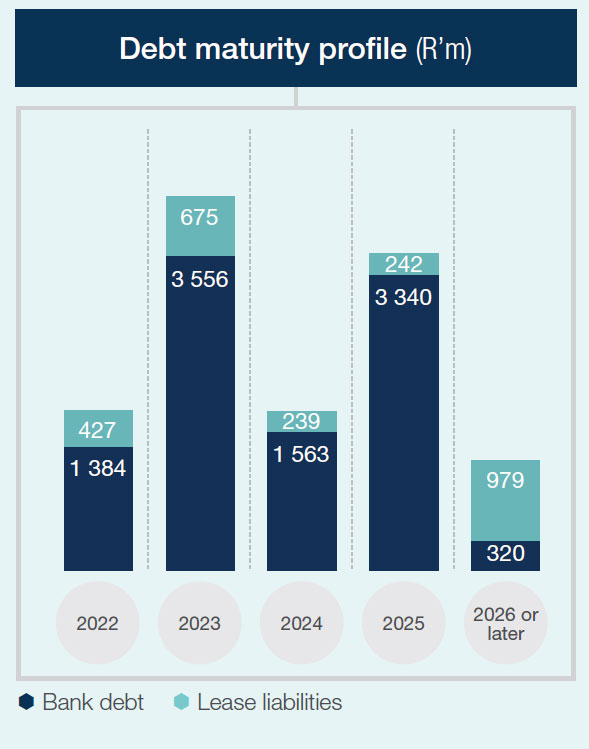
The Group is in a strong financial position with net debt of R10.4 billion (2020: R14.1 billion) leading to a net debt to normalised EBITDA ratio as at 30 September 2021 of 1.82 times (2020: 2.96 times). The net debt figures are calculated in terms of lender agreements.
The Group negotiated amended bank covenants for the periods ended 30 September 2020 (net debt to normalised EBITDA of 4.0 times) and 31 March 2021 (net debt to normalised EBITDA of 4.5 times) due to the uncertainty of the pandemic.
The Group agreed not to pay dividends without lender approval as part of the covenant amendment terms. From 31 March 2021 the Group reverted to its original bank covenant for net debt to normalised EBITDA of 3.50 times.
During 2021 the Group refinanced R2.5 billion of South African term debt, extending maturities that were due during the year and resulting in a lower effective interest rate on this debt. The Group’s undrawn bank facilities as at 30 September 2021 amounted to R6.6 billion (2020: R6.3 billion).
Cash flow and capital expenditure
The Group had strong working capital management despite the challenging environment in which the Group operated. The cash generated from operations amounted to R5.7 billion and represented 113% of normalised EBITDA (2020: 110%).
During the financial year under review, the Group invested approximately R1.9 billion (2020: R2.0 billion), mainly comprising maintenance capital expenditure of R1.5 billion (2020: R1.2 billion) and growth capital expenditure of R357 million (2020: R759 million).
For 2022 we expect expenditure of R1.8 billion on maintenance and R1.1 billion on growth projects.
The increase in maintenance expenditure is driven by some catch-up of the reduced expenditure during 2020 and 2021, as well as increased investment into our IT infrastructure. The significant investment in growth projects will fund the building of a Community Diagnostic Centre in the UK, continued investment in LMI and growth projects within our complementary services business in SA.
DISTRIBUTION
During the year under review. The Board approved a revised distribution policy.
With this distribution policy
in mind, the Board
HAS APPROVED A
final dividend of
25 cps
Zero cps in 2020
HAS APPROVED A
final dividend of
25 cps
Zero cps in 2020
The Group’s dividend policy is to pay a dividend after taking into account the underlying earnings, cash generation and available funding of the Group, while retaining sufficient capital to fund ongoing operations and growth projects while maintaining gearing within acceptable levels.
With this policy in mind, the Board has approved a final dividend of 25 cps (2020: zero cps).
Pieter van der Westhuizen
Group Chief Financial Officer