Statement of value added
for the year ended
Currently viewing: Statement of value added / Next: Chairman's review
for the year ended
| September 2021 R'm |
September 2020 R'm |
September 2019 R'm |
|
| Revenue1 | 26 885 | 23 851 | 25 672 |
|---|---|---|---|
| Less: purchased cost of goods and services | (11 887) | (10 517) | (10 777) |
| Financial value added | 14 998 | 13 334 | 14 895 |
| Other income | 253 | 185 | 232 |
| Financial wealth created | 15 251 | 13 519 | 15 127 |
| Employees | 9 391 | 8 675 | 8 821 |
| Providers of equity | 176 | 974 | 1 559 |
| Providers of funding2 | 315 | 1 489 | 633 |
| Governments | 714 | 597 | 1 185 |
| Maintenance and expansion of capital | 2 026 | 1 952 | 2 179 |
| Reinvestment in the Group3 | 2 629 | (168) | 751 |
| Financial wealth distributed | 15 251 | 13 519 | 15 128 |
| Average number of employees4 | 18 302 | 18 249 | 21 795 |
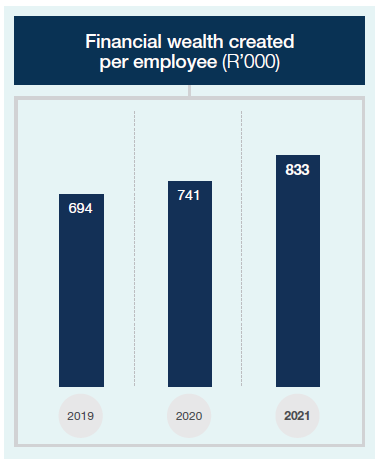
| Financial wealth per employee (R'000) | 833 | 741 | 694 |
| Weighted average number of shares ('m) | 1 454 | 1 455 | 1 451 |
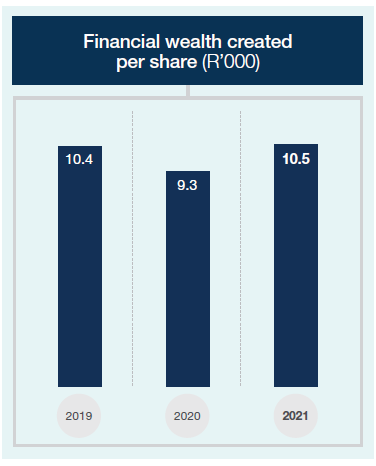
| Financial wealth created per share (R) | 10.5 | 9.3 | 10.4 |
| 1 | 2019 includes revenue from Scanmed |
| 2 | 2019 included R1.5 billion in proceeds from the disposal of Max India which were used to pay down debt, and in 2021 R681 million in proceeds from the disposal of Scanmed were used to reduce debt. |
| 3 | In 2020 the reinvestment in the Group includes impairment of R798 million, with R793 million related to impairment of investment in Scanmed. |
| 4 | 2019 includes Scanmed employee figures. |